


Microsoft Experiment: dotnet-monitor
Microsoft released an experimental tool that allows a consistent method to obtain diagnostic information from .NET Core applications. This new tool is called dotnet-monitor. Depending on the target environment, the setup can differ, but the endpoints for the information collected are the same. This includes on the native OS or inside of a container.
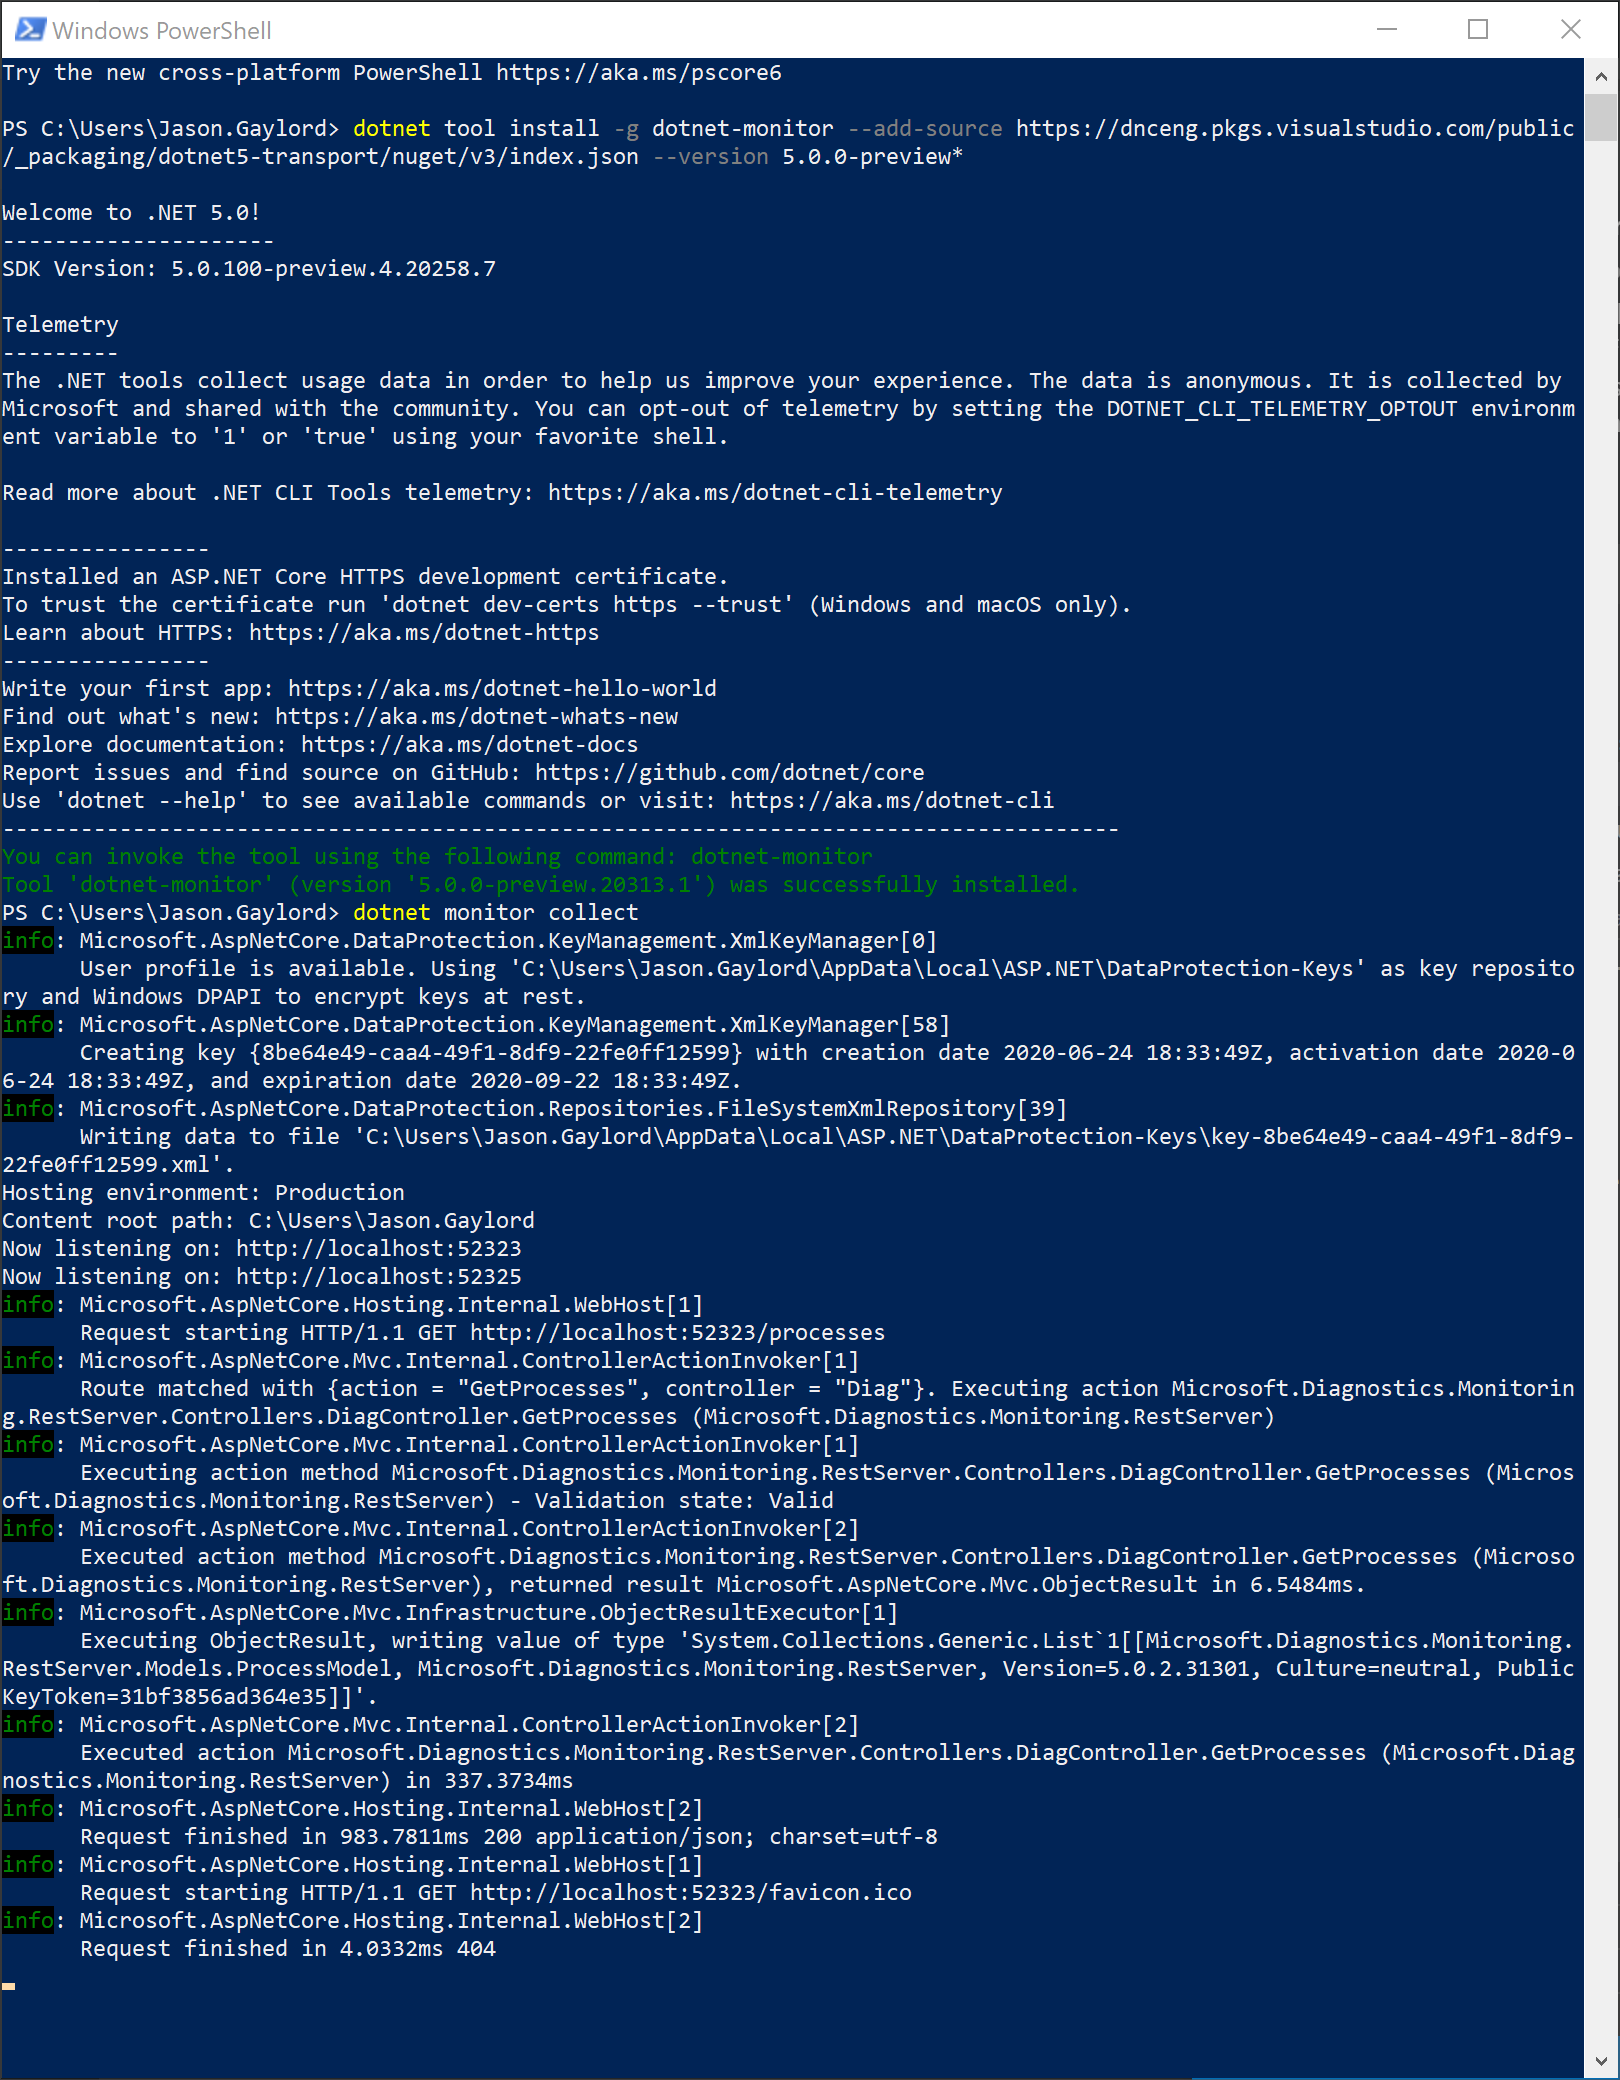
You can see in the screenshot above, I have installed dotnet-monitor using the global tool install method as opposed to using the container image from the Microsoft Container Repository found on the MCR site.
Regardless of install approach, you’ll receive a local URL when you execute dotnet monitor collect. There will be several endpoints you can hit including:
/processes/dump/{pid?}/gcdump/{pid?}/trace/{pid?}/logs/{pid?}/metrics
For more of what you can and can’t do, check out the devblog post by the Microsoft team here.