


Debugging COVID-19 Data Using Excel
When looking for historical Pennsylvania COVID-19 data, I came across the Covid Tracking website. They cover all states and take historical screen shots of the data. The reason I wanted to get this data was to validate the common statement of “Positive Case Numbers are Decreasing.” The reason I wanted this was because I believe that there is a direct correlation between the positive case numbers and the total number of tests. So, to calculate this out, I went to Microsoft Excel.
Pulling Data Into Excel
Excel is a powerful tool. One feature that you may be unaware of is that you can pull in data from the web by letting Excel search the DOM of the webpage finding tables and allowing you to connect to the table. Then, each day, you can refresh the data without having to copy the data and reformat in Excel. You do this by going to the Data menu and choosing From Web.

Next, you’ll enter the website address. So, in my case, I entered the full URL from the browser in the dialogue box that would appear:

From there, you’ll be presented with the Data Navigator. If it’s your first visit to the page, it may take a couple minutes for Excel to review the source code. Choose the table that is appropriate for you.
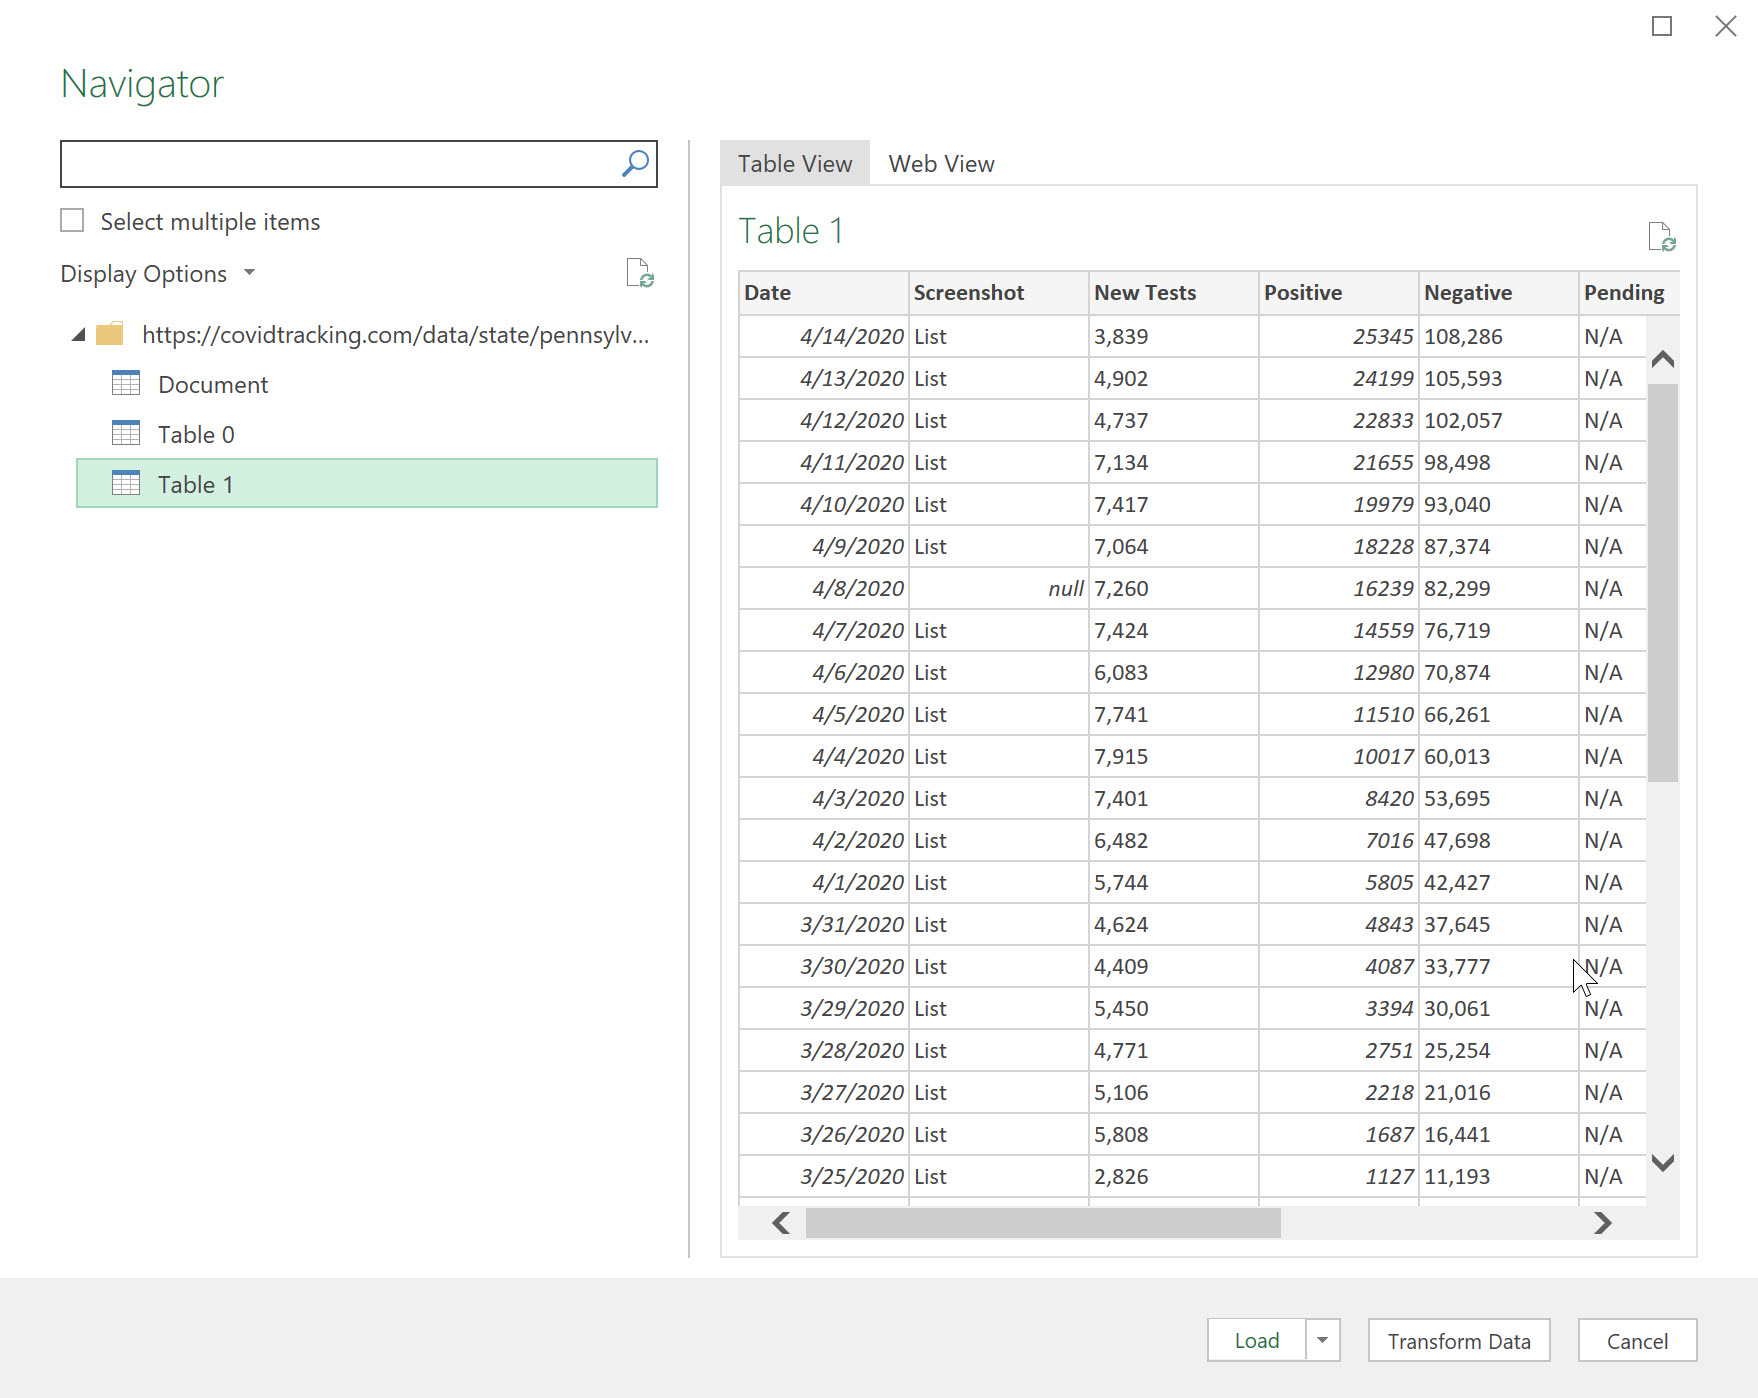
You now have the data in Excel. You can always revisit this spreadsheet and choose Refresh All on the Data menu to refresh the data.
Analyzing the Data
Now that the data is in Excel, I wanted to analyze it a few different ways.
Table 1: Net New Tests and Results
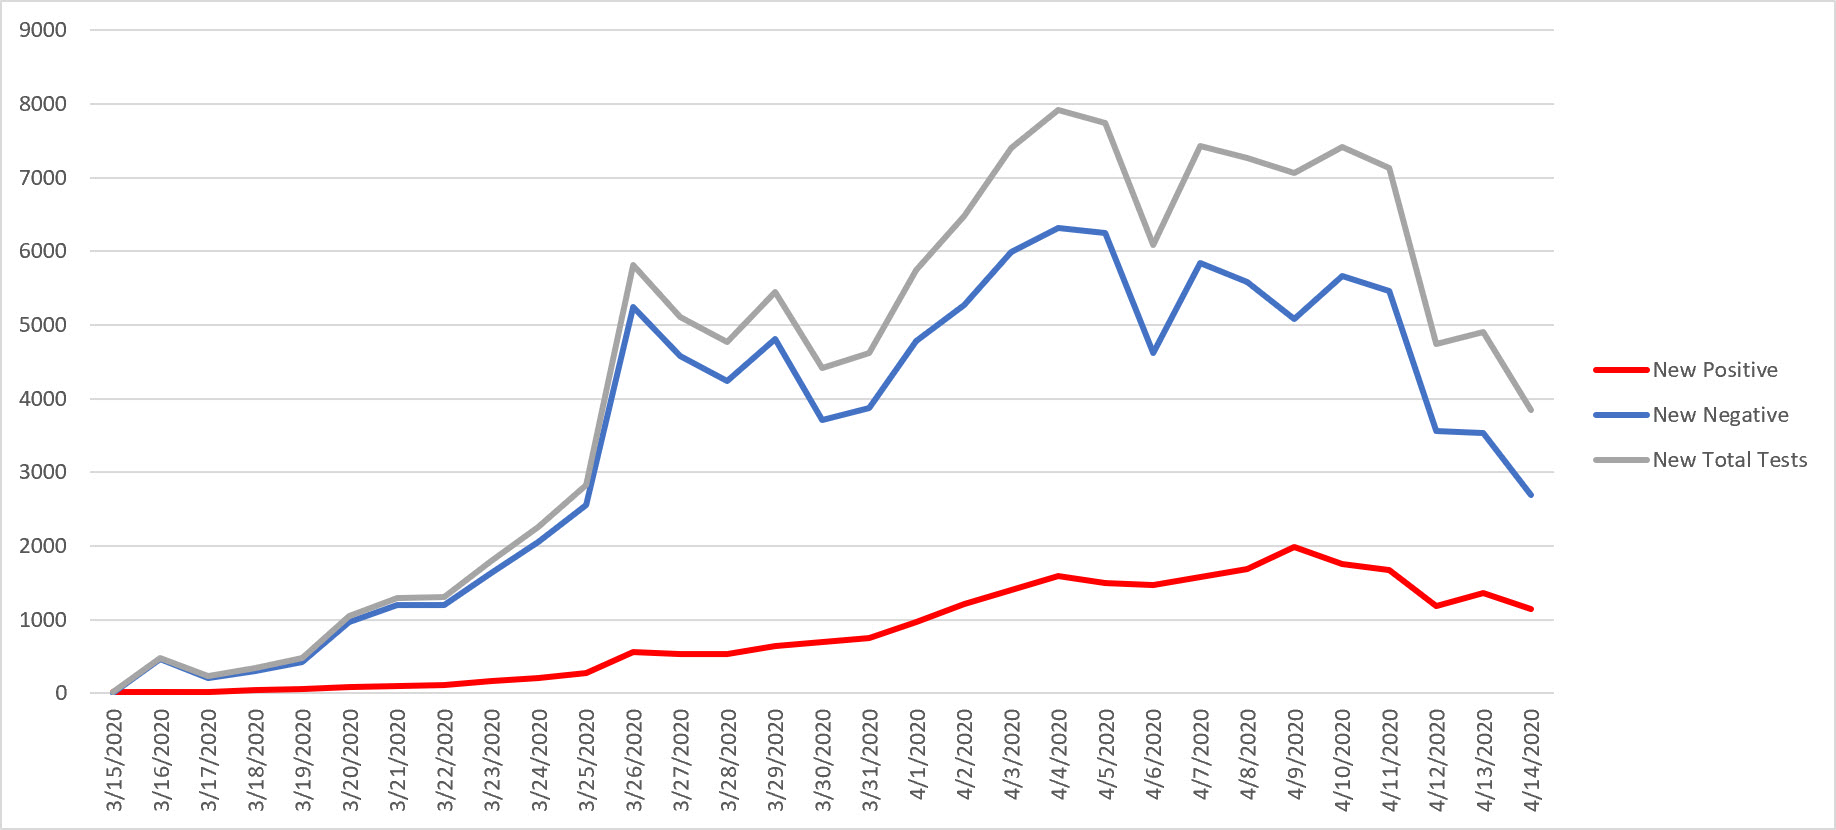
The first table I built was based on the historical data to find the delta, or net new, positive cases, negative cases, and the total test results. Sure, some test results come back in 7 days and some come back in 5 minutes, but the way the data is reported today, I have no choice but to use the numbers in this manner. Looking at the graph below, the grey line is the total number of new test results that have been returned in Pennsylvania. The red line is the new positive cases and the blue line is the new negative cases. The government and media are portraying this as a “slowing down” or a “decrease in new positive cases each day.” Clearly, that’s not the case. The total number of test results is decreasing. There’s a correlation between the two.
Table 2: Positive Results Per 100 Tests
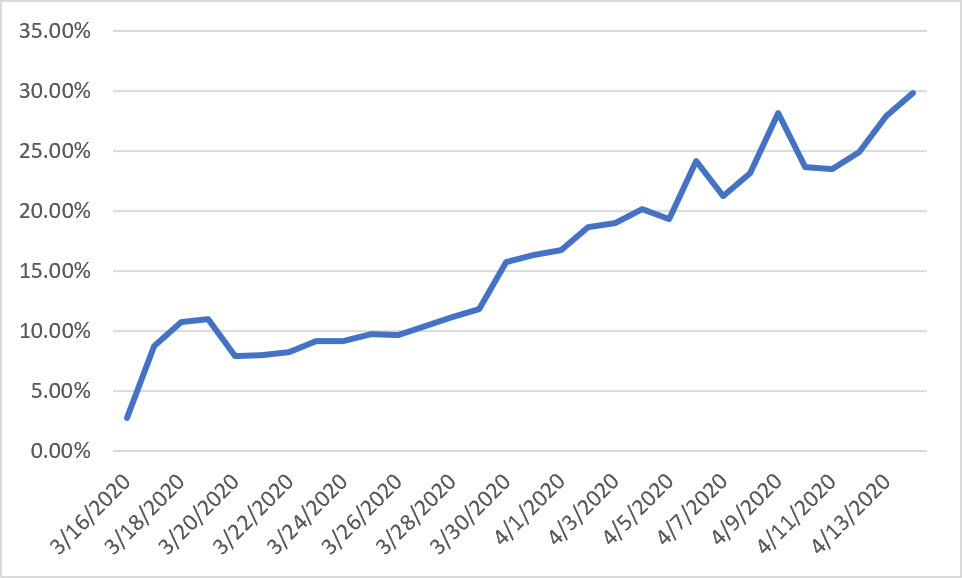
If you now take that data and look at the ratio between the reported new positive cases each day and the new total cases each day, you’ll notice that the average percentage is increasing. Meaning, while we are testing many less individuals (perhaps lack of tests, conditions not serious enough, etc), the percentage that a test will come back as positive is increasing.
Conclusion
We continue to hear estimated dates for “reopening the economy.” However, based on pure data, it doesn’t appear it’s a good idea, does it. I don’t know how anyone can be convinced otherwise unless
Other Posts Related to COVID-19
Below you’ll find the list of other posts in the series:
- COVID-19, Resources, and Technology
- Free Technical Training and Welcome Spring
- Use Docking Station from Home and Add Home Projects
- Technology Events in 2020
- Google’s Stadia Gaming Free for Two Months
- Debugging COVID-19 Data Using Excel
- Hiding Your Background When Working From Home
- Pixel by LabCorp Releases At Home Test
- Blockbuster Surviving Covid-19
- DevAroundTheSun a 24-hour Fundraiser May 12
- Repairing My Lenovo Yoga Pro 2
- Hard Drive Docking Station
- TechBash 2020, TechBash 2021, and COVID-19
- 2020 Year in Review Thus Far
- COVID-19 and Work From Home Update
- CodeMash 2021 is Cancelled
- Comcast Xfinity Data Cap Enforcement
- UPDATE: Comcast Xfinity Data Cap Enforcement
- TechBash 2021 Postponed
- Announcing TechBash 2022